 |
||||||||||||
|
|
||||||||||||
 |
||||||||||||
 |
 |
|||
|
 |
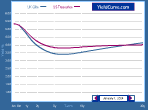
| YieldCurve.com | Yield Curve figures updated weekly since October 2003 To select historical yield curve data use drop-down menu |
|||||
| UK Gilt US Treasury |
6 Month 3 Month |
1 Year 6 Month |
2 Year 2 Year |
5 Year 5 Year |
10 Year 10 Year |
30 Year 30 Year |
| January 1, 2024 show graph |
5.26 | 4.74 | 3.98 | 3.46 | 3.54 | 4.14 |
| 5.35 | 5.26 | 4.25 | 3.84 | 3.87 | 4.02 | |
| December 25, 2023 show graph |
5.23 | 4.78 | 4.03 | 3.46 | 3.51 | 4.07 |
| 5.38 | 5.30 | 4.33 | 3.88 | 3.90 | 4.05 | |
| December 18, 2023 show graph |
5.29 | 4.95 | 4.29 | 3.74 | 3.70 | 4.17 |
| 5.39 | 5.34 | 4.45 | 3.91 | 3.91 | 4.01 | |
| December 11, 2023 show graph |
5.34 | 4.98 | 4.56 | 4.09 | 4.02 | 4.52 |
| 5.39 | 5.39 | 4.72 | 4.24 | 4.23 | 4.31 | |
| December 4, 2023 show graph |
5.34 | 4.83 | 4.51 | 4.10 | 4.14 | 4.67 |
| 5.39 | 5.38 | 4.55 | 4.14 | 4.21 | 4.39 | |
| November 27, 2023 show graph |
5.40 | 4.97 | 4.70 | 4.32 | 4.28 | 4.74 |
| 5.41 | 5.48 | 4.95 | 4.49 | 4.47 | 4.60 | |
| November 20, 2023 show graph |
5.36 | 4.94 | 4.52 | 4.11 | 4.10 | 4.53 |
| 5.40 | 5.42 | 4.89 | 4.45 | 4.44 | 4.59 | |
| November 13, 2023 show graph |
5.40 | 5.02 | 4.66 | 4.33 | 4.33 | 4.77 |
| 5.42 | 5.49 | 5.07 | 4.68 | 4.65 | 4.76 | |
| November 6, 2023 show graph |
5.40 | 4.94 | 4.67 | 4.26 | 4.29 | 4.77 |
| 5.43 | 5.48 | 4.84 | 4.51 | 4.58 | 4.77 | |
| October 30, 2023 show graph |
5.42 | 4.94 | 4.75 | 4.49 | 4.56 | 5.04 |
| 5.46 | 5.55 | 5.01 | 4.77 | 4.85 | 5.02 | |
| October 23, 2023 show graph |
5.42 | 4.91 | 4.87 | 4.63 | 4.65 | 5.11 |
| 5.47 | 5.55 | 5.07 | 4.85 | 4.91 | 5.08 | |
| October 16, 2023 show graph |
5.44 | 5.00 | 4.84 | 4.45 | 4.38 | 4.82 |
| 5.50 | 5.57 | 5.06 | 4.64 | 4.62 | 4.76 | |
| October 9, 2023 show graph |
5.47 | 4.91 | 4.89 | 4.58 | 4.59 | 5.05 |
| 5.51 | 5.59 | 5.08 | 4.75 | 4.79 | 4.96 | |
| October 2, 2023 show graph |
5.43 | 5.08 | 4.91 | 4.53 | 4.46 | 4.92 |
| 5.46 | 5.55 | 5.05 | 4.62 | 4.58 | 4.71 | |
|
Interest rates sourced from market data (includes interpolated yields)

RATE yield curve model Excel Spreadsheets
© YieldCurve.com