

RATE yield curve model Excel Spreadsheets Yield Curves Glossary Contact Us
MONTE CARLO SIMULATIONAbukar M Ali |
Please note that this description and the accompanying spreadsheet are instructional tools, to be used for educational purposes only.
|
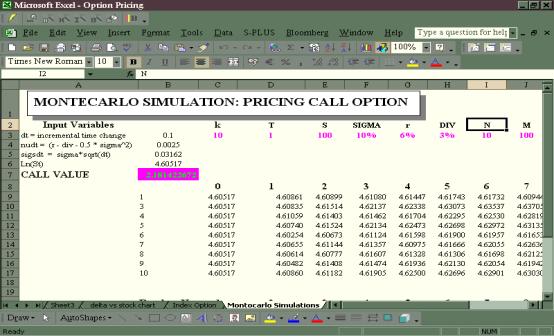
We introduce here Monte Carlo simulation, as an introduction for users of the accompanying Excel spreadsheet application. The purpose of this workbook is to introduce the numerical technique called Monte Carlo simulation, used to price an equity call option. The technique can be extended to more complicated derivatives such as American call options and other path dependent options. A
Monte Carlo simulation
of a stochastic process
is a procedure for sampling
random outcomes for
the process. The most
common way to find the
possible evolution of
a stock by using the
Monte Carlo simulation
is by using the Geometric
Brownian Motion we have
already described. A
path for the stock can
be simulated by sampling
repeatedly for The common way you can use the MC is by sample a random path for a stock S in a risk-free world. Then you can calculate the payoff from the derivative. You can repeat these steps many times in order to get many sample values of the payoff from the derivative. After that we can calculate the mean of the sample payoffs to get an estimate of the expected payoff and finally discount the expected payoff at the risk free rate to get the present value of he derivative. |
| The steps you could follow to find the next periods random value are: |
|
|
| We are coming to the final stage by using the rule: |
|
|
| So, |
|
|
|
By
simply implementing
the above formulae and
solving to |
|
 |
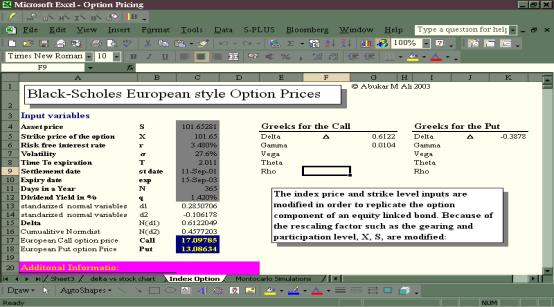 |
In additional to using the numerical Monte Carlo pricing technique for path dependent, American, plain vanilla and other more exotic type of options, a European style option can also be priced by using the Black-Scholes pricing framework.
As the screen shows, to price the latter option, one can see all the required parameters to price the option and the cells from C4 to C12 can be used to input the required parameters. The result output for both the call and the put for the same underling can be observed from cell 17 and 18.
As an exercise change the input parameters and see the impact of the option premium with respect to these changes. In fact, one can use this pricing technique to price similar option that is also attached to other assets such as capital guaranteed products.
For detailed discussion on this see the article by Abukar M Ali, "Equity Linked Notes: and Introduction to Principal Guaranteed Structures", Journal of Bond Trading & Management, Volume 1, Number 3, January 2003.
RATE yield curve model Excel Spreadsheets
© YieldCurve.com